
Last week I wrote about my favorite gold miner, EQX, so I was originally planning on writing about the laggard royalty plays – MTA and UROY. This information is easier to find than normal because there are endless youtube presentations coming out this year’s VRIC conference, so you can get presentations from many of the major mining and exploration companies right now.
This led me to conclude that the problem with MTA and UROY today is essentially the same – they have both been heavily investing in royalties with exploration companies and near-producing miners, and very few of these royalty streams are currently paying. If the price of the underlying metals remains strong, then these mines will continue to build out and the revenue streams will grow. Until then, both of these companies will face heavy losses as their investments outpace their revenues, and they will be reliant on borrowing and selling shares to continue operations.
In contrast, my favorite miners are EQX and AG, which I expect to see considerable growth in revenue and earnings this year. I explained EQX in detail last week. AG is a bit different in that they had one-time costs from their halting of production at Jerrit Canyon and water trouble at one of their silver mines, they are working on getting some revenue out of their ore-processing equipment from mines near Jerrit Canyon by processing other company’s ore, and they just finished creating their own mint for silver bars which will allow them to sell their silver at a higher price point. Stronger earnings should attract more investors while reducing the danger of dilution; instead of selling shares to raise capital, they’ll have excess capital for investing or rewarding shareholders.
As I described last week, the fundamentals behind EQX seemed absolutely incredible while the company traded barely above its Dec 2018 IPO price. As gold has consolidated at, near, and occasionally above its all-time highs over the last 4 years, GDX is down 40% and GDXJ is down over 50% from their 2020 highs. Meanwhile, the charts were starting to look like they have finally carved out bottoms and may be getting ready to turn, just as the gold price brushed to new highs again.
There are many theories about how to trade miners, with narratives of how the senior miners break out first and the juniors follow, or whether the price of gold will go down to follow the miners or the miners will go up to follow gold, so I figured I’d better do a study on how GDX and GDXJ move along with the gold price. GDX started in 2006 and GDXJ in 2009, so I’ll be starting around there.
2006-2010: GDX roughly tracks the gold price until 2008, when it starts breaks much lower as the stock market falters.
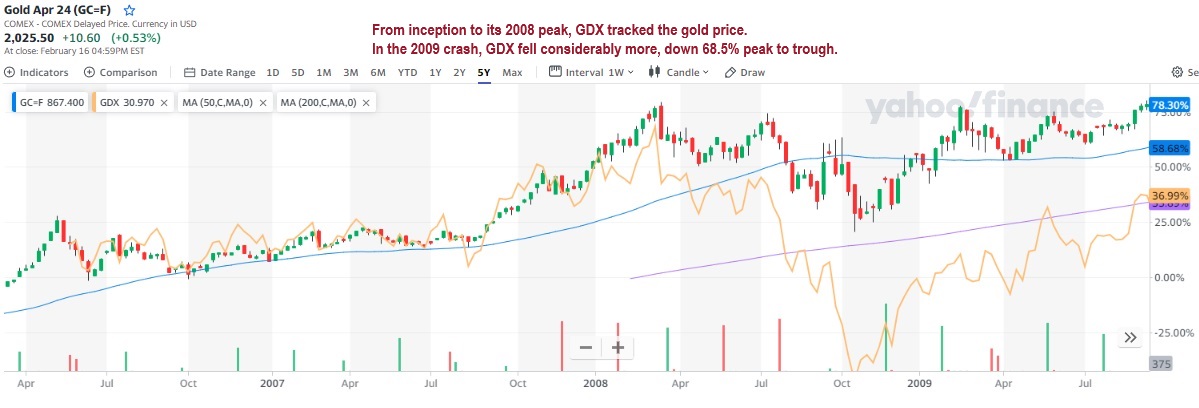
2008-2012: Buying price means everything. If you held GDX from the 2008 peak, you would under-perform the gold price for years. If you held GDX from the 2009 trough, you would outperform the gold price considerably to the next peak in 2011.

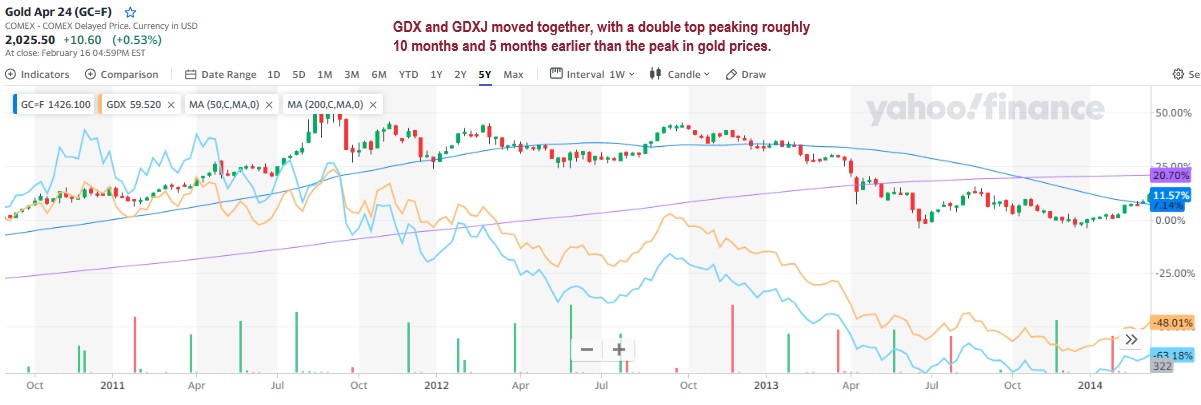
2010-2014: Both GDX and GDXJ traded together, making a double-top and beginning to fall first 10 months, then 5 months before the gold price peaked. Much like today, the miners fell precipitously while gold prices consolidated horizontally into 2012.
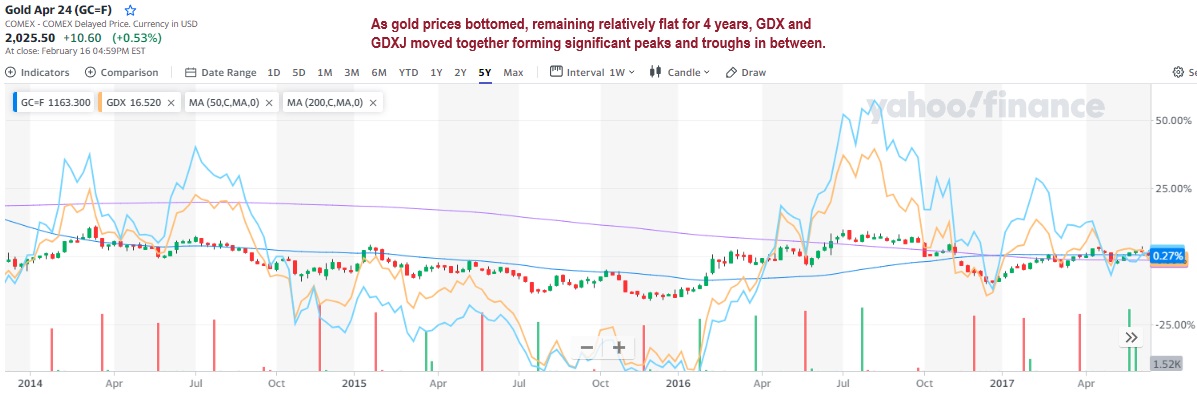
2014-2018: Gold prices carved out a bottom over 4 years of roughly flat prices. Meanwhile, GDX and GDXJ move together forming significant peaks and troughs in between.
2016-2020: GDX and GDXJ carve out two year bottoms between 2017-2019, finally moving back up when gold prices start to climb in 2019. Despite gold prices ending the period with a 16.3% gain though, GDX was down 7.5% and GDXJ down 18.2% over the period.
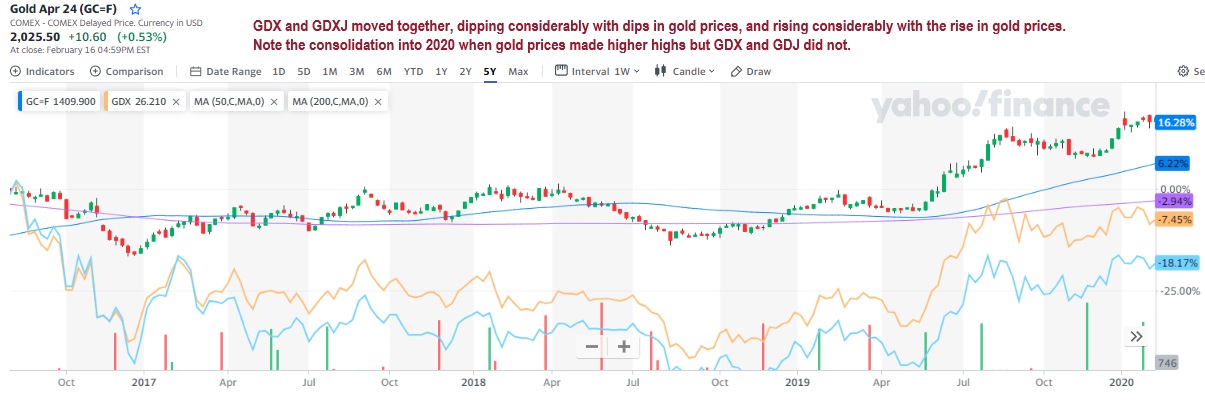
2018-2022: GDX and GDXJ gain nearly 35 in mid 2019 gold price move. Both gold prices and gold miners reach new highs before the March 2020 correction. While the fall in gold prices is quite muted, GDX dips 40% and GDXJ cuts in half during the selloff. Then both soar to their latest all-time highs in August 2020, coincident with the first gold peak.
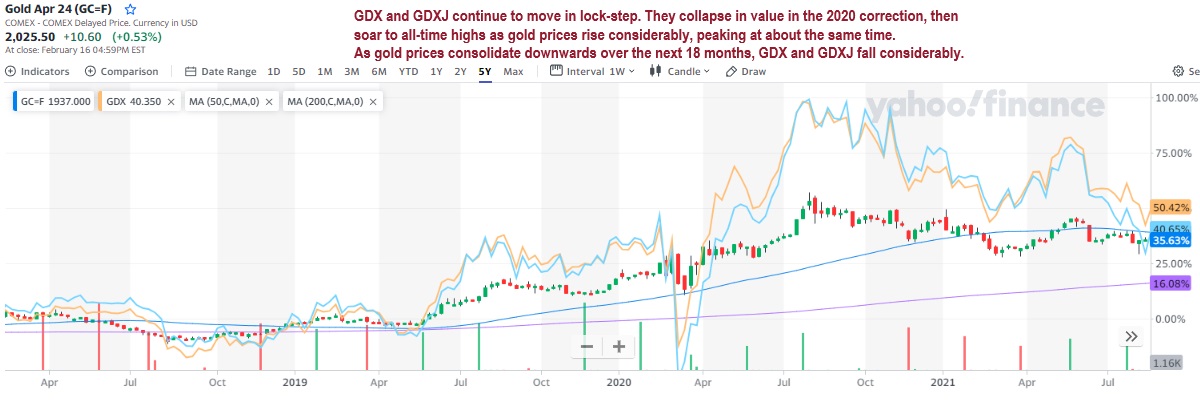
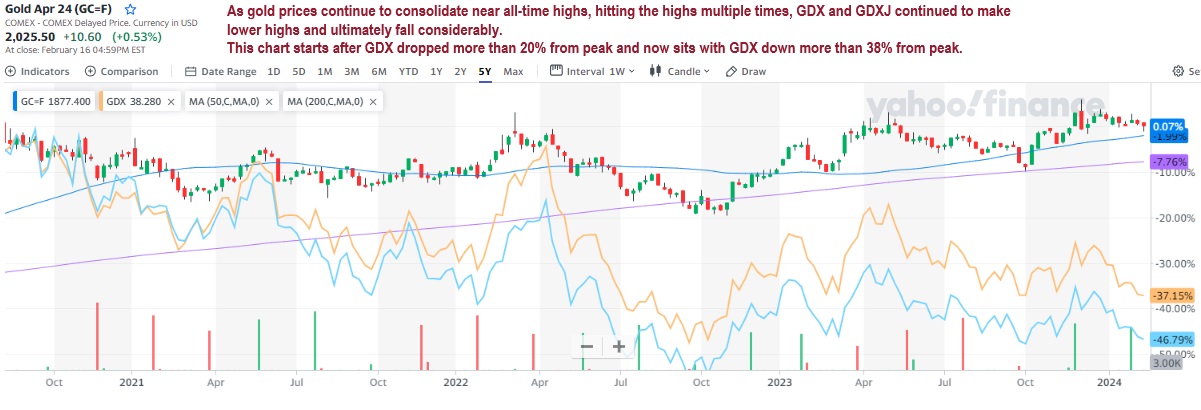
2020-2024: As gold prices consolidate horizontally, testing and occasionally breaking all-time highs 4 times, gold miners fall precipitously. GDX and GDXJ form new peaks coincident with each other and with the gold price, but the first two peaks fail to reach the old high and the following peaks were considerably lower. Now we see gold prices above $2000/oz while GDX and GDXJ are bottoming again, lower than the October and March 2023 lows, but still much higher than the October 2022 lows.
CONCLUSIONS:
- GDX and GDXJ move together, with the moves in GDXJ more pronounced, especially to the downside. Basically, GDXJ behaves like a leveraged GDX fund.
- Note that GDX and GDXJ hold very different companies, but GDXJ doesn’t represent explorers. The top names in GDXJ all have revenues, so they are smaller producers, whereas explorers often have staked claims with no revenue.
- Gold miners are instruments to be traded, not owned. They tend to form major peaks and then underperform for years. Even when these peaks are eclipsed, like GDX in 2011 peaking considerably higher than in 2008, the drops in between are brutal and you need a strategy to avoid them.
- If you manage to buy near a low, gold miners can be rainmakers. From the 2008 low the 2011 high, GDX soared 250%. From the March 2020 low to the Aug 2020 high, GDX soared 240%. Even when gold prices are flat you can get these moves, like Jan 2016 to Aug 2016 where GDX soared 240%. None of these gains last, they are only there if you take them.
This actually has me thinking that I should be watching GDX and being much more aggressive about exiting the sector entirely rather than selling covered calls on the peaks. Before you get carried away from that conclusion, remember that the last big multi-year bull market in miners was 2000-2008, before GDX was created, and this is how Barrick Gold behaved during that time:
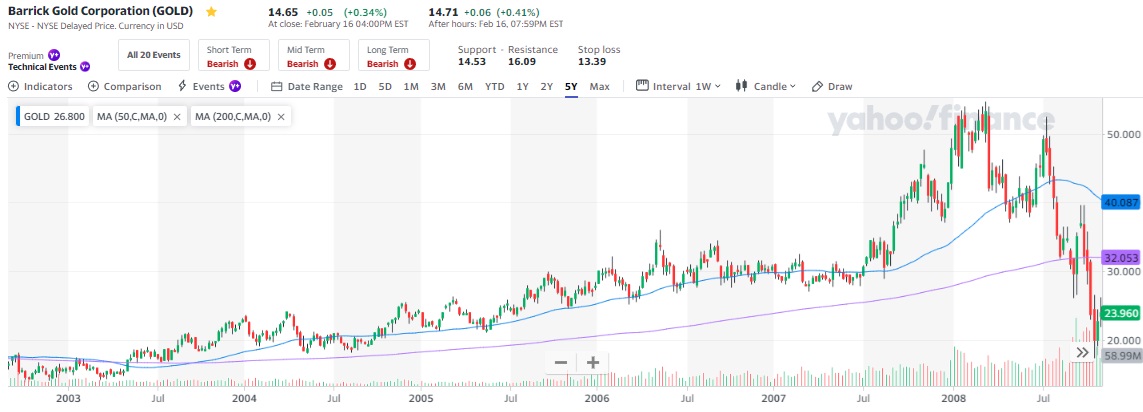
If you’re riding a serious bull market like that one, covered calls at the peaks might be the best strategy. Just never forget the right side, where the gains of the entire period can be wiped out in months.
I’ll leave it there, just know that I’m still feeling very bullish on the miners right now. This week I added a bit more AG and SBSW. Here’s where my allocations ended up:
- HEDGES (10.6%)
- TLT Shares w/cc (10.6%)
- MINING STOCKS (52.8%)
- EQX (5.4%)
- EQX Calls (3.1%)
- MTA (7.3%)
- NEM (5.9%)
- EMX (4.4%)
- AG (4.3%)
- SBSW (4.1%)
- SAND (3.9%)
- SILV (3.4%)
- LGDTF (1.6%)
- MMNGF (1.5%)
- SSVFF (1.5%)
- PGEZF (1.3%)
- SLVRF (1.2%)
- SPPP (1.1%)
- BKRRF (0.8%)
- MGMLF (0.6%)
- DSVSF (0.5%)
- RSNVF (0.5%)
- HAMRF (0.5%)
- URANIUM MINERS (17.8%)
- UROY w/cc (4.8%)
- DNN w/cc (4.1%)
- UUUU w/cc (3.3%)
- EU w/cc (2.3%)
- NXE w/cc (2.3%)
- LTBR w/cc (1.0%)
- US CANNABIS (13.3%)
- VRNOF (2.6%)
- GTBIF (2.5%)
- CURLF (1.8%)
- TCNNF (1.5%)
- GLASF (1.2%)
- AYRWF (1.2%)
- CRLBF (1.0%)
- TSNDF (1.0%)
- CBSTF (0.6%)
- OTHER TRADES (1.7%)
- DOCN w/ cc (1.7%)
- CRYPTO: XRP (3.3%)
- CASH (0.6%)
